Why p-values are the wrong metric for optimization
Short version: 0.05 was never derived. Ronald Fisher called it a convenient cutoff in 1925. Once science made "get under 0.05" the goal, it stopped being a good measure of evidence, which is Goodhart's law. If you want to know whether a result matters, look at effect sizes with confidence intervals, practical significance, statistical power, pre-registration, and replication. A p-value is one input to that judgement. It shouldn't be the finish line.
A cup of tea started all of this
Early 1920s, Rothamsted Experimental Station in England. Fisher offers a colleague, the algae biologist Dr. Muriel Bristol, a cup of tea. She turns it down: she only drinks it with the milk poured in first.
Fisher thinks that's ridiculous. Surely the order makes no difference. She says it does, and that she can taste it. Someone standing nearby (William Roach, who later married her) says: let's test her.
So Fisher designs an experiment. Eight cups, in random order. Four with milk poured first, four with tea poured first. She has to pick out the four milk-first cups.
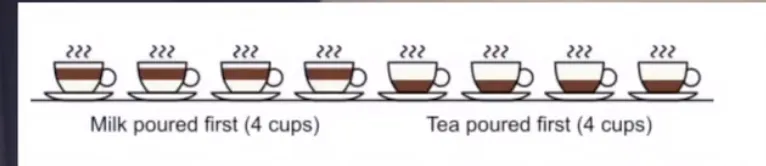
The story goes that she got every one right.
The part people forget is the maths Fisher did before anyone took a sip. There are 70 ways to choose 4 cups out of 8, and only one of them is fully correct. If she were just guessing, her chance of a perfect score was 1 in 70, about 1.4%. Getting at least 3 out of 4 right by luck, on the other hand, happens about 24% of the time (17 of the 70 combinations). So Fisher decided up front that only a perfect score would count as convincing.
That's what everything else rests on. You don't ask "did she get it right?" You ask: if she had no real ability, how surprising would this result be?
Fisher wrote the experiment up in The Design of Experiments (1935), and the reasoning grew into modern hypothesis testing.
Where 0.05 actually came from
The number showed up earlier, in Fisher's 1925 book Statistical Methods for Research Workers. Here's the line that launched a million papers:
"The value for which P = .05, or 1 in 20, is 1.96 or nearly 2; it is convenient to take this point as a limit in judging whether a deviation ought to be considered significant or not." — R.A. Fisher, Statistical Methods for Research Workers (1925)
He didn't derive it from first principles, and there's no deep constant behind it. It sat close to two standard deviations and it was a handy place to draw a line. Fisher even rejected the idea of one fixed line. Three decades later he wrote:
"No scientific worker has a fixed level of significance at which from year to year, and in all circumstances, he rejects hypotheses; he rather gives his mind to each particular case in the light of his evidence and his ideas." — R.A. Fisher, Statistical Methods and Scientific Inference (1956)
The system adopted the number and ignored that advice.
What a p-value actually tells you (and what it doesn't)
A p-value answers one narrow question:
If there were no real effect, how often would I see data at least this extreme just from random noise?
Small p means the data would be surprising if nothing were going on. That's all it means.
One of the most common misreadings, which I've been guilty of in casual explanations too, is "p < 0.05 means there's less than a 5% chance my result is a fluke." It doesn't mean that. The American Statistical Association said so explicitly in its 2016 statement on p-values:
- P-values do not measure the probability that your hypothesis is true, or the probability that the data came from chance alone.
- A p-value does not measure the size of an effect or how important a result is.
- Scientific conclusions and policy decisions should not rest only on whether a p-value crosses a threshold.
So even when it's used correctly, a p-value can't tell you whether an effect is big, whether it's real, or whether anyone should care. That's a lot of weight to put on something that answers none of those questions.
The problem: 0.05 became a target
Economists have a name for this. Goodhart's law, in anthropologist Marilyn Strathern's phrasing: "When a measure becomes a target, it ceases to be a good measure."
Fisher meant p < 0.05 as a signal: this might be worth a closer look. Journals, grant committees and tenure reviews turned it into a gate: this gets published. When careers depend on clearing the gate, people learn to clear it, and the p-value stops tracking what it was meant to track.

(Credit: @aca.memia.)
Here's what it breaks.
1. A rounding error decides a paper's fate
A result at p = 0.049 gets published. The same study at p = 0.051 gets filed away. The evidence is practically identical, but the outcomes are opposite.
Statisticians Andrew Gelman and Hal Stern made the point in a paper whose title says it all: The Difference Between "Significant" and "Not Significant" Is Not Itself Statistically Significant (2006). Rosnow and Rosenthal said it more memorably back in 1989: "Surely, God loves the .06 nearly as much as the .05."
2. P-hacking
If the goal is to get under 0.05, there are plenty of legal-looking ways to get there. Keep collecting data until it tips over. Try several outcome measures and report the one that worked. Drop "outliers." Add or remove a control variable. Split by subgroup.
In a famous 2011 paper, Simmons, Nelson and Simonsohn showed that combining just four of these common "researcher degrees of freedom" pushed the false-positive rate from the advertised 5% to about 61% (False-Positive Psychology, Psychological Science). To prove the point, they used real data to "show" that listening to a Beatles song made people younger.
At that point you're not discovering anything. You're torturing the data until it tells you what you wanted to hear.
3. The literature fills with results that don't replicate
When a big collaboration tried to replicate 100 published psychology studies, 97% of the originals had reported significant results, but only 36% of the replications did, and the replicated effects were on average about half the size (Open Science Collaboration, Science, 2015).
Selection is a big part of why. If only results under 0.05 get published, the published record is biased towards lucky, inflated estimates.
4. "Significant" gets confused with "important"
With a big enough sample, almost anything becomes statistically significant. In the Physicians' Health Study, which enrolled 22,000+ people, aspirin's effect on heart attacks was significant at p < 0.00001 and the trial was stopped early. But the absolute risk difference was 0.77%, and aspirin explained about 0.1% of the variance in outcomes (Sullivan & Feinn, 2012). That can still matter at population scale. The point is that the p-value alone tells you nothing about how much.
Scientists are already moving away from it
This isn't a fringe complaint.
- 2015: The journal Basic and Applied Social Psychology banned p-values and significance testing outright.
- 2016: The ASA published its first-ever formal statement on a specific statistical practice, the p-value statement quoted above.
- 2018: 72 researchers proposed lowering the default to p < 0.005 for claims of new discoveries.
- 2019: More than 800 scientists signed a Nature comment titled Scientists rise up against statistical significance, calling for the concept of "statistical significance" to be retired. The same year The American Statistician published a 43-paper special issue, Moving to a World Beyond "p < 0.05".
Notice that these proposals disagree with each other. Some want a stricter threshold, some want no threshold at all. They agree on one thing: a single number crossing a single line is not a conclusion.
What to focus on instead
If p < 0.05 is a bad target, what should you actually look at when you run a study or read one? Here's the checklist I'd use.
| Instead of asking... | Ask... | Metric / practice |
|---|---|---|
| "Is it significant?" | "How big is the effect?" | Effect size (Cohen's d, risk difference, odds ratio, raw units) |
| "Did it cross 0.05?" | "What range of effects fits the data?" | Confidence / compatibility intervals |
| "Is it real?" | "Does it matter in practice?" | Practical / clinical significance (e.g. minimal clinically important difference) |
| "Did we find something?" | "Could we have found it if it existed?" | Statistical power and planned sample size |
| "What did the analysis show?" | "Was the analysis decided in advance?" | Pre-registration / Registered Reports |
| "Is this one study convincing?" | "Does it hold up again?" | Replication and meta-analysis |
1. Effect sizes, in units people understand
Start with how big. "The drug lowered blood pressure by 4 mmHg" tells you something. "p = 0.03" tells you nearly nothing. Report effects in real-world units wherever you can, and use standardized effect sizes (Cohen's d, correlation r, odds ratios) when you need to compare across studies.
2. Confidence intervals, read as ranges rather than pass/fail
A 95% confidence interval gives the range of effect sizes reasonably compatible with your data. An interval of [0.1, 8.0] and an interval of [3.9, 4.1] can both be "significant," but they describe very different amounts of knowledge. Some statisticians now call them compatibility intervals to discourage people from just checking whether zero is inside.
Don't reduce the interval to "does it cross zero?" That just brings back the p-value problem with extra steps.
3. Practical significance
Decide before the study what size of effect would actually matter: to patients, to users, to your business. In medicine this is the minimal clinically important difference. In A/B testing it's your minimum detectable effect worth shipping. A result can be highly significant and completely irrelevant, or non-significant and still worth following up.
4. Power
Low-powered studies are a trap in both directions. They miss real effects, and when they do find something, the estimate tends to be exaggerated, because only the lucky overestimates clear the bar. Run a power analysis before collecting data and choose a sample size that can actually detect the effect you care about.
5. Pre-registration and Registered Reports
Most p-hacking works because the analysis gets decided after you've seen the data. Pre-registration fixes your hypotheses and analysis plan up front. Registered Reports go further: the journal peer-reviews and accepts the study before results exist, so publication no longer depends on the p-value.
The effect is striking. One comparison found that 96% of standard psychology papers reported positive results, versus 44% of Registered Reports (Scheel, Schijen & Lakens, 2021). The gap is roughly how much of the literature depends on the gate rather than the truth.
6. Replication and the weight of evidence
A single study is one data point. What actually convinces people is an effect that shows up again in independent samples and survives a meta-analysis. If you're reading research, ask whether anyone else found it too.
7. (Optional) Bayesian measures
If you want to directly ask "how much should this change my belief?", Bayesian tools like Bayes factors and posterior probabilities answer that question more directly than a p-value can. They make you state your prior assumptions openly, which is a feature, not a bug.
So is the p-value useless?
No. Used as Fisher intended, it's a perfectly good measure of how surprising your data would be under "nothing is going on." That's useful.
The trouble starts when that one number becomes the goal. The lady tasting tea is a good reminder of what Fisher actually cared about: design the experiment carefully, decide ahead of time what would convince you, and then think about the result. He didn't want anyone reading a number off a table and stopping there.
In 1925 0.05 was a sensible rule of thumb. It became a problem once everyone started aiming for it.
Next up: a proper breakdown of what a p-value is, with the maths, the intuition, and the common mistakes.